
Plots: Past, Present, and Future
Earlier this year, I backed away from the Julia community to pursue a full time opportunity with the exciting AI startup Elemental Cognition as a senior engineer. Elemental Cognition was founded by Dave Ferrucci, the AI visionary that led the original IBM Watson team to victory in Jeopardy. We’re a small team (though we’re hiring!) of talented and passionate researchers and engineers, some of whom were instrumental in the success of Watson, working to build machines with common sense and reasoning (thought partners, if you will). It’s incredibly interesting, but it also doesn’t leave time for hobbies.
In this post I wanted to provide some perspective on the Plots project, from origin to today, as well as to speculate on its future. If you have further questions about this project (or any of my other open source efforts), please use the public forums (Github, Discourse, Gitter, Slack) to seek help from other users and developers, as I have very little capacity to answer emails or messages sent directly to me. (Not to mention I probably won’t have the most up to date answer!)
Past
I spent my career in finance building custom visualization software to analyze and monitor my trading and portfolios. When I started using Julia, the visualization options were not exciting. Most available packages were slow, lacking features, or cumbersome to use (or all of those things). As both the primary designer and user of my software in my previous roles, I knew a better approach was possible.
In 2015, early in my Julia experience, I created Qwt.jl, a Julia interface to a slightly customized wrapper of the Qwt visualization framework. I used it primarily to analyze trading simulations and watch networks of spiking neurons fire. It was (IMO) a massive step up in cleanliness and usability compared to my experiences doing visualization in Python, C++, and Java. I am a nut for convenience, and made sure all the defaults were set such that 90% of the time they were exactly what I wanted. Qwt.jl could be thought of as the design inspiration for the API of Plots.
In August of 2015, a bunch of devs in the Julia community (most of which had “competing” visualization packages) set up the JuliaPlot (note the missing “s”) organization to discuss the state of Julia visualization. We all agreed that the community was too fragmented but most thought it was too hard a problem to tackle properly. Each package had many strengths and weaknesses, and there was large difference in supported feature sets and API style.
I laid out a rough plan for “one interface to rule them all”. It was not well received, with the biggest objection that it wasn’t likely to be successful. People, after all, have very different preferences in naming, styles, and requirements. It would be impossible to please enough people enough of the time to make the time investment worthwhile. Now, telling me something is impossible is an effective way to motivate me. I pushed the initial commits of Plots that weekend.
Present
Plots (and the larger JuliaPlots ecosystem) has been (again, IMO) a wildly successful project. Is it perfect? Of course not. Nothing is. There are precompilation issues, unsatisfying customization of legends, minimal interactivity, and more. But it has received a large following of loyal users and (much more important) dedicated contributors and maintainers.
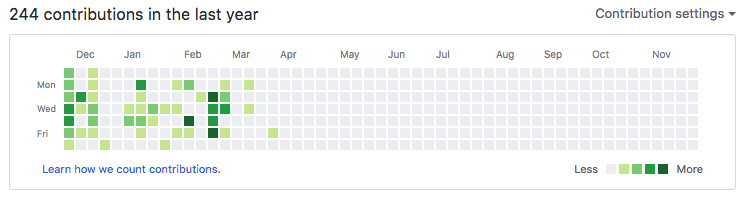
Sadly, I don’t have the ability to work on the project, as described above. In fact, I bet you can guess when I joined Elemental Cognition given my Github activity:
However, even though I’ve backed away from the project, it is in good hands with many people invested in its continued success. Looking at the list of contributors to Plots (64 people at the time of writing this post) and the graph of commits (below), it seems very clear that this is an active and passionate community of Julia visualizers that care about the success of the ecosystem.
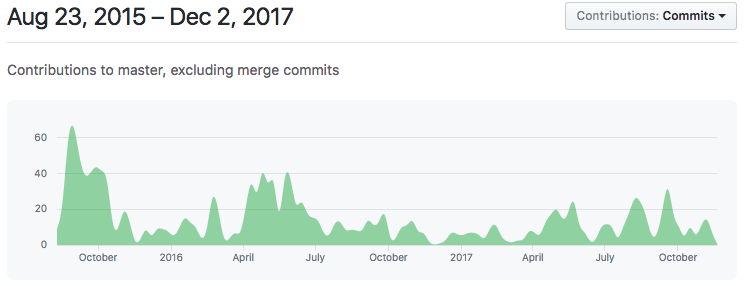
In fact, this graph seems to show that activity has risen since I handed over responsibility of the organization to the JuliaPlots team. I reason that my departure gave other members the courage to take a more active role, before which their contributions were not as aggressive and passionate.
The design of RecipesBase and the recipes concept has ensured that, even if something better comes along to replace the Plots core, things like StatPlots, PlotRecipes, and many other custom recipes can still be used. This is a motivating idea when deciding whether to invest time in a project… knowing that a contributed recipe can outlast the plotting package it was designed for. This is a primary reason that I expect JuliaPlots to remain active and vibrant.
Future
There are many ways to make visualization in Julia better. We need better compilation performance, fewer bugs, better support for interactive workflows, more complete documentation, as well as countless other issues. The number of things that can be improved is a testament to how insanely difficult it is to build a visualization platform. It’s perfectly natural to have 10 different solutions, because there are 1,000 different ways to look at a dataset. How could one solution possibly cover everything?
During (and after) JuliaCon 2016, Simon Danisch and I had a bunch of brainstorming sessions diving into how we could improve the core Plots engine. These conversations were mostly centered around strategies to support better performance and interactivity in the Plots API and core loop. We also wanted to give backends more control over lazily recomputing attributes and data, and optional updates to subparts of the visualization (when few things have changed). The goal was marrying extreme flexibility with extreme performance (similar to the goal of Julia itself).
I hope that Simon’s latest project MakiE is the realization of those ideas and goals. I would consider it a big success if he could replace the core of Plots with a new engine, without losing any of the flexibility and features that currently exist. Of course, it will be a ridiculously massive effort to achieve feature-parity without tapping into recipes framework and the Plots API. So my skepticism rests on the question of whether the existing concepts can be mapped into a MakiE engine. I wish Simon the best of luck!
Aside from large rebuilds, there is some low-hanging fruit to a better ecosystem, some of which will be helped by things like “Pkg3” and other core Julia improvements. Also, the (eventual) release of Julia 1.0 will bring a wave of new development effort to fill in the gaps and add missing features.
All things told, I have high hopes for the future of Julia and especially the visualization, data science, and machine learning sub-communities within. I hope to find my way back to the language someday!